
Table of Contents
# Introduction to EDA Extracting Patterns and Anomalies
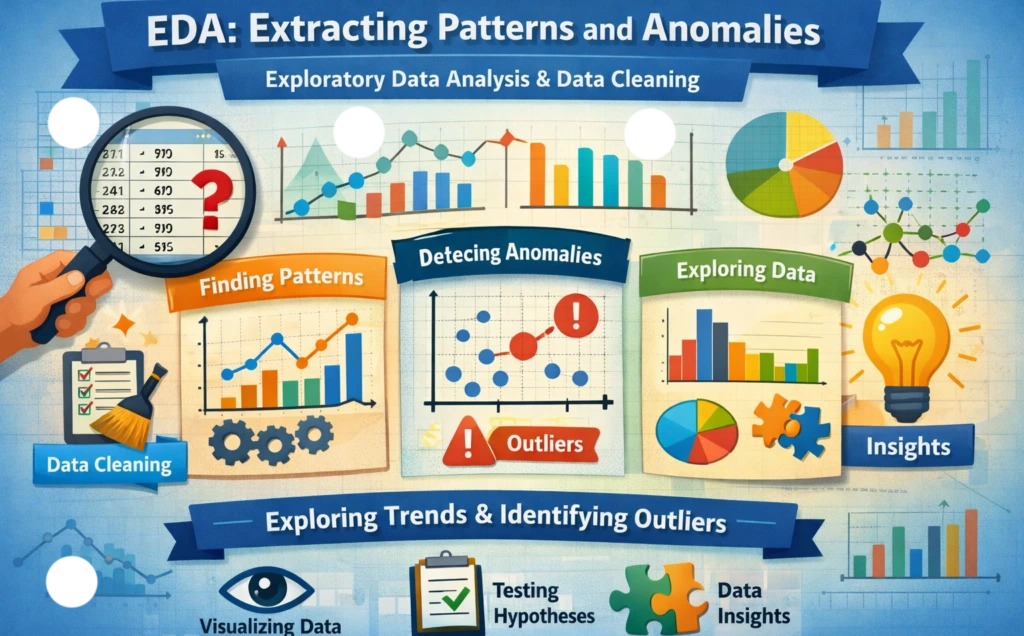
In data preprocessing, exploratory data analysis involves an examination of data and cleaning as well as data preparation with the aim of extracting patterns and anomalies or testing hypotheses, without the use of a statistical model or tests. In other words, it is the first step in the analysis of data when we perform some primary manipulation on the data to observe the features and properties of the data.
To this end, the present paper aims to make a case for EDA extracting patterns and anomalies
There are numerous reasons why data exploratory analysis is essential, such as:
1. Data Quality
It’s an important part of determining and improving the quality of your raw data before you even formally model or run any statistical test. Descriptive statistics and visualizations also enable analysts to identify missing data, duplications, recording mistakes, and lack of coherence between variables. In the sense that EDA aids in exposing outliers, such inspection may help to find errors of scale If this is done, it should usually be reported, and it should not be unless there is a good reason for doing so.
Furthermore, EDA extracting patterns and anomalies, as well as logical consistency between variables (e.g., means should not be negative in a situation where none are expected). By addressing these data quality issues at the beginning, EDA aims to ensure that results of subsequent analyses will be based on trustworthy information and that research findings are stronger and more valid.
2. Understanding the Data
It is a data preview and we get to know about the dataset holistically (structure, behavior, etc.). By summarizing the center, spread, and distributional properties of the variable brought to light by EDA, researchers are able to understand the nature of an individual feature as well as its relationship with other features. With visualization tools like family histograms, box plots, scatter plots, and relation graphs, you can discover patterns in data points (trends), seasonality, or outliers that might be hard to observe when looking at numeric output.
With this deeper attitude, scientists are now more sensitive to true links between variables, transformations that maybe should be applied, and methods of intelligible operation. Fundamentally, EDA extracting patterns and anomalies is the bridge separating raw and formal analysis that turns bad big data into good data.
3. Hypothesis Testing
While hypothesis testing is typically performed using statistical models, EDA still plays a role in this exploratory phase as well. Researchers can visually and descriptively analyze the pattern of relationships between variables to assess whether their initial hypotheses are tenable. Scatter plots and trend evaluation can be early signs of linear or non-linear correlations, whereas group comparisons may indicate differences between categories.
EDA extracting patterns and anomalies is also useful to check the underlying assumptions behind statistical tests, such as normality, homoscedasticity, and independence. The sooner violations to such assumptions can be observed, the earlier researchers may change their hypothesis or model or decide on a different data transformation. Accordingly, EDA enhances the soundness of hypothesis testing by minimizing misjudgments.
4. Identifying Insights
The most important benefit of EDA is that it discovers hidden insights in the data. By ‘successively’ I mean EDA can flag unexpected patterns, associations, or trends when it is taken step-by-step. That kind of information is useful for decisions and resource management in our context, and also this is extremely important in the data processing.
In applied research fields (such as economics, finance, social sciences, etc.), EDA can provide information to discover structural changes/behaviors or cues of interest. In particular, EDA could reshape complex data sets into actionable recommendations for evidence-informed decision-making and potentially imbue practical applicability to research outputs.
Different tools and techniques used in data exploratory analysis
Descriptive Statistics
It may be added that descriptive statistics are indispensable tools in exploratory data analysis, which provide a means for summarizing or condensing large amounts of numerical data into meaningful measures. Measures of central tendency (mean, median, and mode) describe the average or middle value of variables, whereas measures of dispersion (standard deviation, variance, range, and interquartile range [IQR]) show how spread out the data is.
These summary statistics will assist the researchers in getting acquainted quickly with the overall dataset behavior, locating possible extreme values, and making comparisons on variables or groups. For example, if the mean and median differ widely, then the distribution may be lopsided to one side or the other. Descriptive statistics thus form the basis of the understanding of a dataset before performing more advanced types of analyses.
Visualizations
Data visualization forms an integral part of the EDA extracting patterns and anomalies, as it helps in converting numerical data into visuals, which are easier to read and let us understand things better. Some popular visualizations are: Histograms Bar charts Line graphs Scatter plots Box plots, heat maps, etc., which aid in understanding trends, patterns, seasonality, and anomalies.
Advanced visualization libraries like Python’s Matplotlib and Seaborn or R’s ggplot2 facilitate flexible, high‐quality graphics. In big data scenarios, such as Hadoop systems, they are heavily used to analyze massive and intricate datasets. Visualizations help analysts to develop an understanding of relationships and distributions but are also central in communicating findings to non-technical consumers.
Univariate Analysis
Univariate analysis is about taking one aspect, the independent variable, at a time. This sort of analysis tries to determine the distribution, centrality, variance, and shape of a dataset. Univariate analysis often includes methods such as frequency distribution tables, histograms, density functions, and boxplots.
In this way, skewness, kurtosis, and missing values have been captured in such a manner that outliers, etc., if any exist, can potentially affect subsequent investigation. It is especially important to conduct univariate analysis when deciding if the variables are normally distributed or non-normally distributed, as this will guide the selection of proper statistical tests and transformation techniques.
Bivariate and Multivariate Analysis
Bivariate and multivariate analysis looks at two or more variables in association. Bivariate Analysis: Bivariate analysis examines the relationship between two variables and includes methods like scatter plots, cross-tabulation, or correlation coefficient. Instead, multivariate analysis generalizes this to several variables so that investigators may examine more complex patterns.
Such analyses are necessary for detecting patterns of dependence, multicollinearity, and interaction between variables. In the field of economics and business, for example, bivariate (covariation) or multivariate EDA extracting patterns and anomalies, can assist in identifying relations, e.g., between inflation and interest rates or income and consumption. This step is a preparation for the model selection and hypothesis testing.
Outlier Detection
The task of outlier detection is to identify observations that are far from the rest. Outliers can occur as a result of measurement error or from errors during data entry or due to genuine extreme values. Popular ways to detect outliers are using the z-score, the box plot, and the IQR method.
The outliers can significantly affect the statistical indices, especially the mean and standard deviation, which would also affect the results of modeling. “EDA extracting patterns and anomalies permits this decision to be made in a thoughtful and considered manner by the researcher using considerations of theory, knowledge, and aims of investigation.” A valid and reliable outcome of the analytical results will be achieved if outliers are treated correctly.
Correlation Analysis
The strength and direction of the relationship between two variables are measured by correlation analysis. The correlation coefficient (mean square contingency or Kendall tau) is the most widely used, e.g., Pearson’s correlation for linear relations and Spearman rank correlation for non-parametric or monotonic relations.
Correlation analysis allows researchers to distinguish between variables moving in alignment positively and negatively or at cross purposes. This method is useful in the initial stages of analysis to identify any possible relationships that may need further exploration. However, EDA extracting patterns and anomalies insists that correlation is not causation and any observed association needs to be substantiated with sound phenomenological motivation as well as in-depth statistical validation.
learn more about EDA in public part 2 by towords data science
Conclusion
Therefore, data exploratory analysis (EDA extracting patterns and anomalies) should be considered as an important step in any data analysis process. This is the most excellent way of ensuring that one spends good time and makes adequate effort to analyze their data with the intention of making good decisions for the improvement of business outcomes. If you are going to start with exploratory analysis, then do this by using a few of the tools specified above in this text and ensuring that the results of the analysis are well communicated to the different stakeholders.
Hope you enjoy information on EDA extracting patterns and anomalies