
A small Data Analysis project based on the SQLite and Python Libraries
By Adeeb Mir, Dec. 7, 2025
Introduction
Modern BI and decision-making procedures base their work on data analysis. SQLite integrated with Pandas in Python is one of the best ways to blend the systems of database management and data analysis. In this post, we shall understand about a Python script that will help parse the employee data stored in SQLite and how these are so interconnected.
Day-to-Day Data Insights using SQLite and Python Pandas
Today, analysis of data has emerged as an important focus in business intelligence and decision-making. SQLite with the Pandas module in Python is one of the best integration models for connecting database management and analysis. In this post I would like to discuss one of my Python scripts for employee data analysis in SQLite and how these things are so well integrated.
Setting the Stage: Heatmap & Data of Reading and Importing Libraries
The journey begins with importing essential Python libraries:
Pandas: To make and alter data with view to handing them to the analytical tools.
SQLite3: Offers the ability to attach to and interrogate SQLite databases.
Our first step is going to be to read some employee data from a CSV file we have named Employee_Years.csv and place it into a new Pandas DataFrame that we named company. Hint: Pandas is a powerful tool that allows an analyst to transform and analyze the data with the help of the vast feature set of Pandas.
Data is provided in the format pd.read_csv(“Employee_Years.csv”), where you get the company.
First, download useful libraries.
Code:
import pandas as pd

import sqlite3
The read file code is:
company=pd.read_csv("Employee_Years.csv")To display the first five rows of data, use the code Company.head().
Company.head()
Writing Data to SQLite
The data regarding employees is then stored into an SQLite database with the help of the Pandas to_sql method, where a table employee is formed. In this step, the general process of moving data files from flat files (CSV) to and from relational databases is illustrated.
conn = company.to_sql(‘employee’, if_exists= ‘replace’)
output = 5880
The script is currently retrieving data from SQLite.
The script from the script folder reads data from the employee table with the help of the pd.read_sql function. This behavior means it becomes relatively easy to query a backend with SQL statements or perform all processing in Python.
This employee dataset is stored in a Pandas data frame.
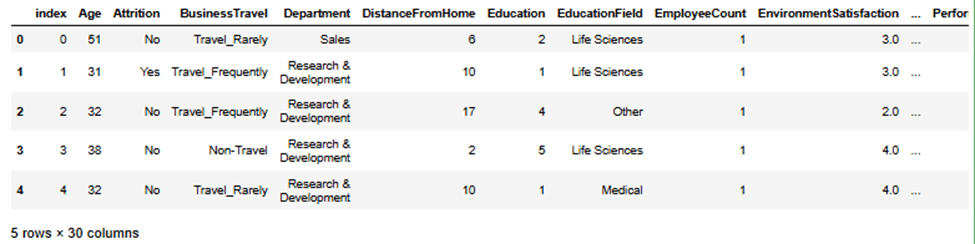
mytb = pd.read_sql(‘SELECT * FROM employee’, conn)to show a table code.
mytb.head()Output would be
Querying with SQL on Big Data
1. Consideration of how many employees reside distant from the workplace.
The script calculates how many employees met the condition where DistanceFromHome > 10. This kind of query enables identification of the commuting difficulties in the workforce.
- Sql query for this manipulation is:
pd.read_sql("select count(DistanceFromHome) from employee as total_rows where DistanceFromHome > 10",conn)output would be
| count | (DistanceFromHome) |
| 0 | 1776 |
2. Average environment satisfaction done by each department
It takes the EnvironmentSatisfaction field and then looks into the three departments with the highest average satisfaction levels. The insight also shows the areas of employees’ satisfaction for further focused approaches.
pd.read_sql("select department, avg(EnvironmentSatisfaction) as meanSat from employee group by Department order by meanSat desc limit 3 ", conn)Output:
| EducationField field_dst | ||
|---|---|---|
| 0 | Human Resources | 28 |
| 1 | Life Sciences | 29 |
| 2 | Marketing | 29 |
| 3 | Medical | 29 |
| 4 | Other | 29 |
| 5 | Technical Degree | 29 |
3. The maximum distance of travel varies by field of education.
The maximum distance of travel is determined by every single field of education. This analysis helps in making modifications to the employee support programs depending on educational backgrounds.
pd.read_sql("select EducationField, max(DistanceFromHome) as field_dst from employee group by EducationField" ,conn )Output;
| EducationField distance | ||
|---|---|---|
| 0 | Human Resources | 28 |
| 1 | Life Sciences | 29 |
| 2 | Marketing | 29 |
| 3 | Medical | 29 |
| 4 | Other | 29 |
| 5 | Technical Degree | 29 |
4. Department performance Appraisal
It is possible to find the PerformanceRating scores for departments. This query superimposes a layer of productivity dynamics on the organizational units.
pd.read_sql("select department , PerformanceRating from employee where PerformanceRating >=3 group by department ", conn)Output:
| dept p-rating | ||
|---|---|---|
| 0 | Human Resources | 4 |
| 1 | Research & Development | 4 |
| 2 | Sales | 3 |
5. Employee attrition is one of the issues that should be comprehended.
Focusing on employees marked as “Yes” for attrition, the script aggregates various statistics: DistanceFromHome, average EnvironmentSatisfaction and average Age. This analysis assists in establishing the reasons why employees quit the organization.
pd.read_sql("select  sum(DistanceFromHome), avg(EnvironmentSatisfaction), count(EnvironmentSatisfaction) as totalEnv , avg(Age)
 from employee where Attrition =='Yes'  ",conn)
Output:
| sum(DistanceFromHome) | avg(EnvironmentSatisfaction) | totalEnv | avg(Age) |
| 8928 | 2.467656 | 943 | 33.60 |
Practical Takeaways
1. Improving Great Data Understanding with SQL and Pandas
This script demonstrates how Pandas and SQL allow developers to use SQL for querying a database with all the other nice analytical things that Python can do.
2. As we are going to discuss the actual applications of HR analytics, let’s first define what HR analytics is.
Such data-driven methods are critical in developing HR strategy and organization decision making, for instance from satisfaction levels of employees to turnover.
3. It is also very efficient with the handling of relational data.
Here in this article, we illustrate a highly efficient manner in which structured data can be handled for query and analysis with no added overhead imposing huge DB servers, by bridging Python and SQLite.
Conclusion
This script in this blog is a good example of how with simple tools, such as SQLite and Python’s Pandas, one can do a very complex analysis. Regardless of whether you are an HR professional or data scientist, these methods can be used to gain insight on data for better decision-making.
For more external sources.